Croston's Intermittent is the method used to handle sporadic data (no seasonality). For example, a manufacturer has inventory that is constantly in sporadic demand; that is, there are no precursors to when orders will be placed, or it could be that the demand is often zero, even though the average demand may be for several units. This situation causes an over calculation of the average or mean demand. Orders do not arrive at predictable times, so there are times when the manufacturer is over or understocked.
Croston's Intermittent is specifically designed to deal with such a situation with a two-step process. The main goal is to provide a good safety stock, resulting in a situation where the manufacturer is neither over nor under stocked. This is accomplished by considering two aspects of the data: the demand size and the demand occurrence.
To use the Croston Intermittent forecasting technique:
- Click on
 and open the ForecastingExamples.xls file.
Note: The ForecastXExamples.xls file is a data example to demonstrate how Croston’s Intermittent method is used. For your company’s purposes, you will have your own data available. - Open Croston’s spreadsheet.
- Click in a cell containing data and open ForecastX by clicking on
 .
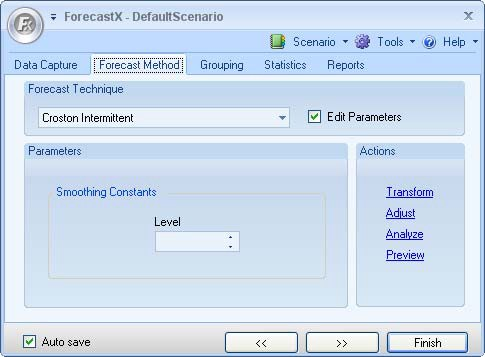
. - Select the Forecast Method tab and scroll through the list of forecasting techniques and select Croston Intermittent. The Croston Intermittent Forecasting technique displays.
- On the Reports tab, select Standard Report.
- Select the Standard and Chart in Table checkboxes.
- Click Finish.
ForecastX confirms that sales are affected in the months preceding and following a holiday. According to the forecast, sales through your distribution outlet continue to increase over the next three years.
Below is the graph, Chart1, produced by the Standard report. Notice how sporadic the data is.
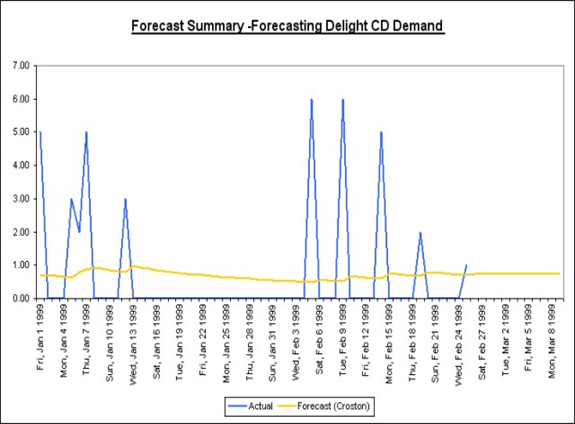
With Croston's Intermittent forecasting method, you can control and smooth sporadic data. This method provides excellent results for product control and forecasted demand. In the standard report, you can see the MAPE is 75.05% and the R-Square is 0.