Census X-11 is a refined seasonal-decomposition method. It seasonally adjusts and decomposes your data through a series of predefined steps:
- Seasonal (Trend)
- Cycle (Random)
A seasonal component of a time series occurs regularly, such as Christmas; while a cycle has a duration that varies from cycle to cycle. Economic variables are cyclical. A depression occurs at irregular intervals.
During the forecasting process, Census X-11 factors in trading days to refine the forecast and reduce the irregular component of the forecast by weighing each period by the number of trading days.
ForecastX™ enables you to account for trading days or forecast without adjusting for trading days. The former produces more accurate forecasts when trading days are important; this is especially useful if the number of trading days dramatically affects the amount of business that is done in a time period.
Trading days also can be specifically known for each time period. For example, you can determine how many trading days each of the last 12 months contained by reviewing how many official working days took place. You can also determine how many trading days are going to occur over the next 36 months, for example.
Census X-11 also identifies two types of Seasonality:
- Additive
- Multiplicative
Census X-11 is best suited for a series where the number of days in the time period directly affects the values in those time periods.
To use the Census X-11 forecasting method:
-
Click on
 and open the tutorial_CX11_Columns.xls file.
Note: The Tutorial_CX11_Columns.xls file is a data example to demonstrate how the Census X-11 method is used. For your company’s purposes, you will have your own data available. - Click in a cell containing data and open ForecastX by clicking on
 .
.
ForecastX displays with the Data Capture tab open.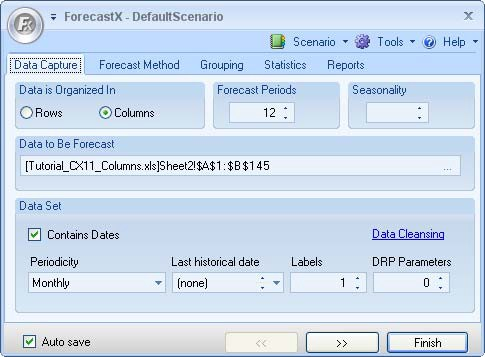
Note: Notice ForecastX automatically selects your data and indicates it is in columns. - Select the Contains Dates checkbox and ensure that Monthly is selected.
- In the Forecast periods textbox, type in 36 to Forecast three years into the future.
- In the Seasonality textbox, type in 12.
- Select the Forecast Method tab and scroll through the list of forecasting techniques and select Census X-11. The Census X-11 Forecasting technique displays.
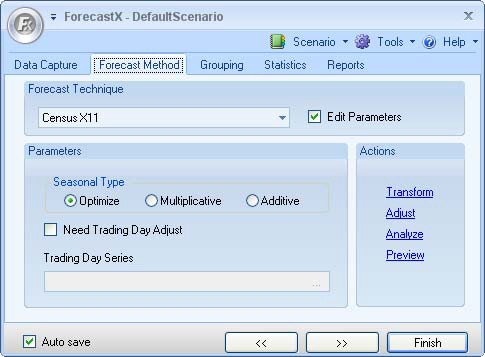
- Select Edit parameters to activate the parameters.
- On the Report tab, select Executive Report and uncheck any other available options.
- Click Finish.
Notice ForecastX confirms that sales are affected in the months preceding and following a holiday. According to the forecast, sales through your distribution outlet continue to increase over the next three years.
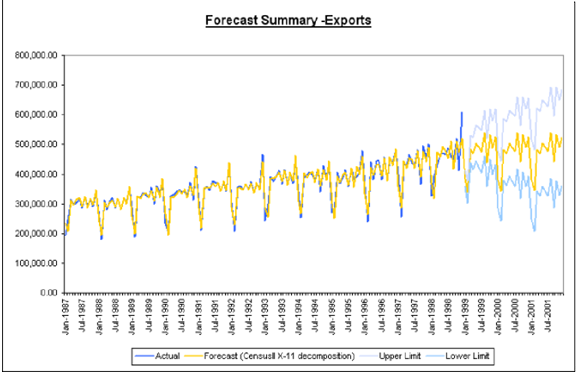
Considering you did not take the actual number of business or trading days into account, the average error of your forecast is 3.81%.
If you decide to run a forecast that does account for the actual trading days in each month, your results will be a more accurate forecast.
Using Advanced Census X-11 with ForecastX
To use the Advanced Census X-11 forecasting technique:
- Click on
 and open the Tutorial_CX11_Columns.xls file.
Note: The Tutorial_CX11_Columns.xls file is a data example to demonstrate how the Census X-11 method is used. For your company’s purposes, you will have your own data available. - Click in a cell containing data and open the ForecastX by clicking on
 .
.
Note: Notice ForecastX automatically selects your data and indicates it is in columns. - Select the Contains dates checkbox and ensure that Monthly is selected.
- In the Forecast periods textbox, type in 36 to Forecast three years into the future.
- In the Seasonality textbox, type in 12.
- Select the Forecast Method tab and scroll through the list of forecasting techniques and select Census X-11. The Census X-11 forecasting technique displays.
- In the Seasonal Type area, select Multiplicative. This type spreads the total values from each month over the actual number of trading days of each month.
- Select Need Trading Day Adjust.
- Click the in the Trading Day Series textbox. The Wizard window displays.
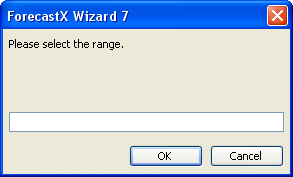
- To choose the range of trading days, select which cells to include in the trading days in column D of the Excel sheet.
- Click OK when finished.
- On the Reports tab, select Audit Trail Reports option and deselect any other options.
- Click Finish.
The Audit Trail report is much more detailed than the Executive report. For example, there is detailed information about the method you selected, Census X-11, along with the decomposition type you specified, multiplicative. You chose multiplicative because you wanted to spread the values from each month over the actual number of trading days for each month.