Trend (Linear) Regression analysis uses an equation to analyze the relationship between two or more quantitative variables in order to predict one from the other(s). Linear Regression measures the relationship between two variables: X and Y. X is the independent variable and Y is the dependent variable. A particular observation of Y depends on X and an additional random error.
Y = mX + b
ForecastX™ estimates the best-fit regression line for any input data. However, the user must first make an analysis about the estimated model and whether it provides meaningful information. A question that often arises is whether the forecasted relationship between X and Y exists, and if it does, how good does the regression line fit. There are several ways to evaluate and judge the goodness-of-fit of a regression.
The variance of the dependent variable around the independent variable can be estimated using sample data. A common statistic used to judge the accuracy of the regression is called the Standard Error of the estimation. A large Standard Error indicates a lot of residual or error variation, which signifies a poor fit. If the Standard Error is small, there is a minimal amount of residual variation, thus the fit is good. The Standard Error of the estimation helps determine how accurate the model is for prediction. The difficulty in using the Standard Error is making judgments about how large errors can be before they become unacceptable.
Another common statistic is the Coefficient of Determination. The Coefficient of Determination, or R-Squared, helps make a better judgment about the model's goodness-of-fit.
The R-Squared produces a percentage error term rather than a numerical one. The percentage represents the variation in the Y variable as explained by the regression. If the R-Squared is large (98%, 89%, etc.), the model is providing a good fit and you can have confidence in its ability to predict. However, if the RSquared is small, the model is not providing a good fit and you should have less confidence in its ability to predict. Even with the R-Squared, there is still ambiguity about how large the percentage needs to be in order to be considered a good fit. Hypothesis tests such as the F-Test and T- Test enable us to make better judgments about the model as a whole.
The T-Test is used to make a judgment about the variable m, or the slope coefficient. This test indicates whether m is significantly different than zero. Again, if m is significantly different than zero, there is a relationship between the dependent and independent variable. For Linear Regression, the F-Test and the T-Test deduce the same conclusions. Audit Trail offers users great detail of the corresponding statistics in ANOVA table and coefficient table. For more information about these statistics, refer to the Statistics section.
Though in general linear regression, the values in X can be any number, most useful linear regression model uses predefined values in the series X. In ForecastX, the values are 1, 2, 3, ….
Since the values are fixed, X is an implicit series, users do not provide this series in their input data. In some case, a linear regression model with b=0 is needed, where m is the interception. ForecastX ™ provides an option to force the value of m to be zero.
To use the Trend (Linear) Regression forecasting technique:
- Click on
 and open the ForecastingExamples.xls file.
Note: The ForecastingExamples.xls file is a data example to demonstrate how the Trend (Linear) Regression method is used. For your company’s purposes, you will have your own data available. - Click on the Linear Regression sheet.
- Click in a cell containing data and open ForecastX by clicking on
 . The Data capture window is displayed.
 - Click on the Forecast Method tab and select Trend (Linear) Regression from the Forecast Technique drop down list.
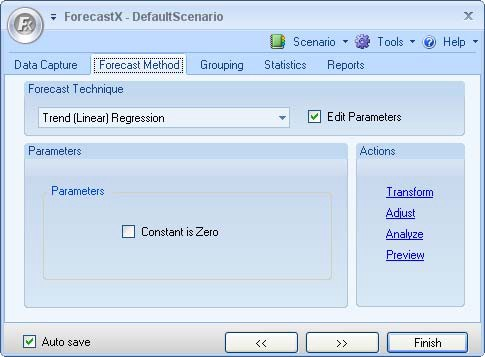
-
On the Reports tab, select Audit Trail report.
-
Click Finish.
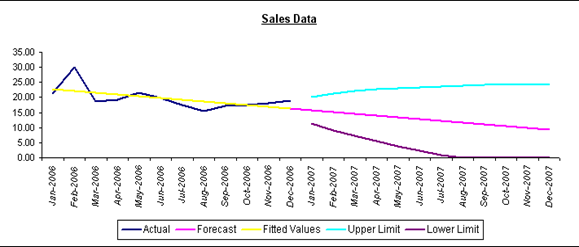
The Audit Trail graph depicts three aspects of your data:
- Actual observations
- Smoothed values
- Forecasted values
The graph shows the trend of your sales data.
The Audit Trail report calculates the accuracy and descriptive statistics you need to determine if the Regression model chosen is optimal.
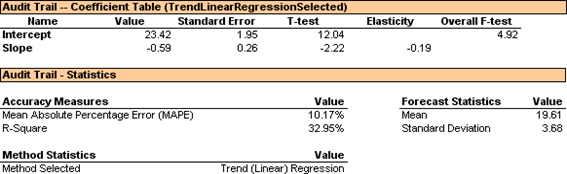
The Mean Absolute Percentage Error (MAPE) is 10.17% and represents the average of the errors in your forecast. The Audit Trail Coefficient Table displays your T-Test and F-Test values, which indicate the goodness-of-fit of your regression model. Since the F- Test value is large, 4.92, you know that the independent variable time in your example has a significant influence on the dependent variable sales.
Based on the statistics generated, Trend (Linear) Regression is an optimal Forecasting method for this particular data set. Trend (Linear) Regression is best used when one independent variable significantly influences a dependent variable.