Slow Moving Demand is used to calculate the optimal Stock level for sporadic data. The forecasting method works well with items that consist of many zeroes and items that have variable Non-seasonal demand. Croston forecasting method assumes that demand has a normal distribution; Slow Moving Demand assumes that all demand has some Seasonality.
When this forecast method is used the if the Safety Stock opinion line is used in any of your reports, including the DRP reports, the Safety Stock will be taken from the calculations provided by this forecast method.
To use the Slow Moving Demand forecasting technique:
- Click on
 and open the ForecastingExamples.xls file.
Note: The ForecastingExamples.xls file is a data example to demonstrate how the Slow Moving Demand method is used. For your company’s purposes, you will have your own data available. - Click the SlowMethod tab at the bottom of the Excel sheet to select the example spreadsheet.
- Click in a cell containing data and open ForecastX™ by clicking on
 . ForecastX displays.
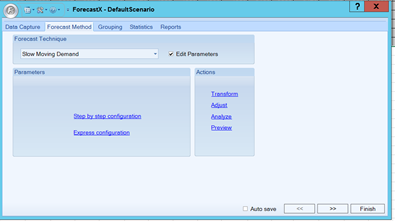
 - Click on the Forecast Method tab.
- In the Forecast Technique area, scroll through the list of methods and select Slow Moving Demand. The Slow Moving Demand Forecasting technique displays.
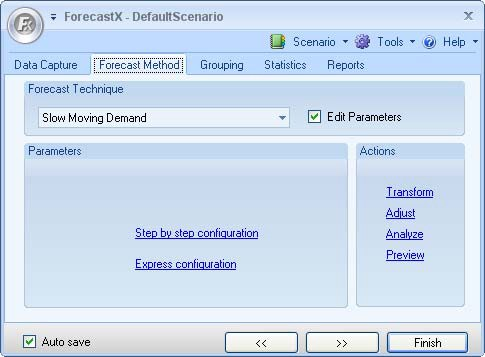
- Select Edit parameters to activate Slow Moving Demand’s parameters.
There are two different types of configurations. Each works in the same way. However, the Step by step configuration walks you through the process and provides information to help you make the best selections.
- Step by step configuration
- Express configuration
Step by Step Configuration
Please see the Express Configuration section below for detailed information on each selection provided. To use the Step by step configuration:
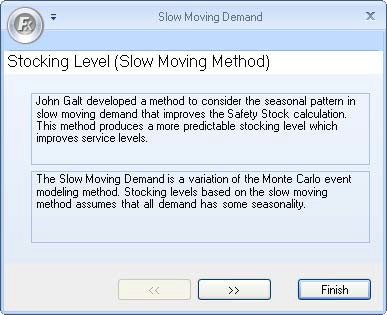
- From the Forecast Method tab, click on the Step by step configuration link.
The Stocking Level window displays.
- Click the forward arrows to go to the next step. The Event Index Creation window displays.
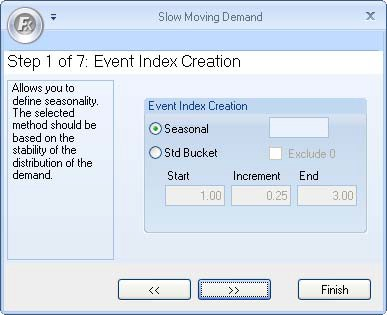
- In the Event Index Creation area, select either Seasonal or Std Bucket to define the Seasonality. If you selected Std Bucket, check Exclude 0 if you do not want zeroes in the Event Index creation.
- Type in the Start, Increment, and End values.
- Click the forward arrows to go to the next step. The Number of Simulations window displays.
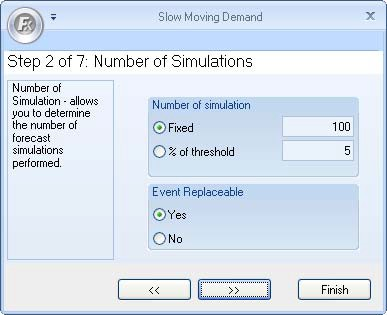
- In the Number of simulation area, select either Fixed or % of threshold. Type in a number for either option selected.
- In the Event Replaceable area, select Yes or No.
- Click the forward arrows to go to the next step. The Best Calculation Method window displays.
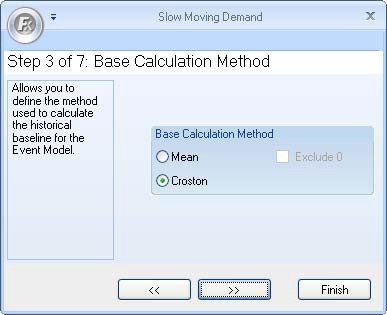
- In the Base Calculation Method area, select either Mean or Croston. If you chose Mean, check the Exclude 0 checkbox if you do not want 0 to be part of the calculation.
- Click the forward arrows to go to the next step. The Base Forecast Method window displays.
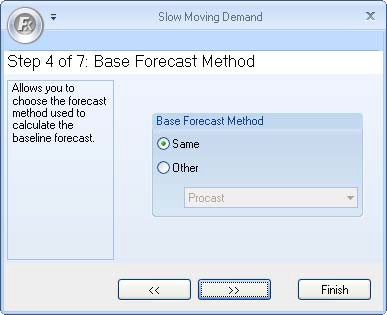
- In the Base Forecast Method area, select either Same or If you chose Other, select a forecasting method from the dropdown list.
- Click the forward arrows to go to the next step. The Service Level As window displays.
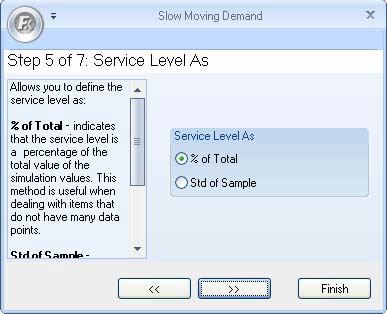
- In the Service Level As area, select either % of Total or Std of Sample.
- Click the forward arrows to go to the next step. The Safety Stock window displays.
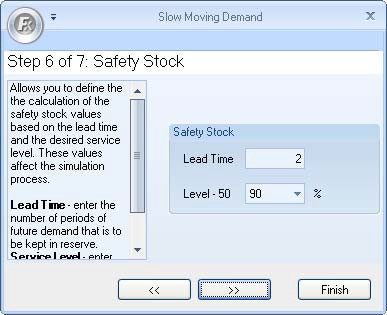
- In the Safety Stock area, type in the Lead Time.
- Select a percentage level in the Level-50 dropdown.
- Click the forward arrows to go to the next step. The Service Level in History window displays.
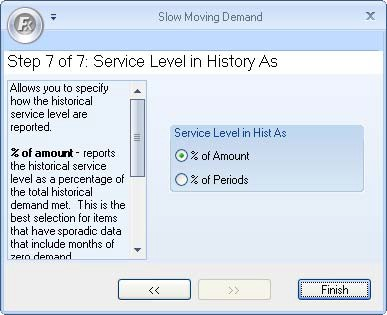
- In the Service Level in Hist As area, select either % of Amount or % of Periods.
- Click Finish.
Express Configuration
To use the Express Configuration:
- From the Forecast Method tab, click on the Express configuration link. The Slow Moving Demand window displays.
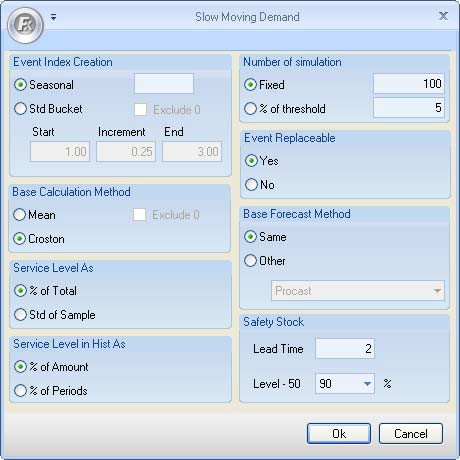
The table below details what each feature means. Please see the Step by Step Configuration section above if you would like to see how the Slow Moving Demand walks you through the selections provided.
| Feature | Description |
| Event Index Creation | Defines the Seasonality. |
| Seasonal | Identifies the data is cyclical. Enter the number of periods that define the season cycle. |
| Std Bucket | Creates an Event Index based on the Mean and the Standard Deviation in the data. |
| Exclude 0 (Event Index Creation) | Excludes the leading zeroes in the calculation. |
| Start | Type in the first value in the range for the Event Index. |
| Inc | Defines the amount of lift from period to period that should be included in the Event Index. |
| End | Type in the last value in the range for the Event Index. The value should be at least two points greater than the Start value. |
| Base Calculation Method | Determines the method used to calculate the Historical baseline for the Event Model. |
| Mean | Uses the Mean as the Historical baseline. |
| Croston | Calculates the Historical baseline using the Croston Method. |
| Exclude 0 (Base Calculation Method) | Excludes zeroes in the calculation. |
| Service Level As | Defines the Safety Stock levels. |
| % of total | Sorts the simulated values in ascending order and then selects the value that is tied to the percentage specified. Uses the percentage that you entered in the Safety Stock Level value. |
| Std of Sample | Determines if the Standard Deviation of the simulated data is to be used as the Service Level for Safety Stock. Assumes that the data follows a normal distribution. |
| Service Level in Hist As | Calculates the Historical service level, if the Safety Stock value in the past is the same as the Forecasted Safety Stock value. |
| % of Amount | Calculates the Historical service level in a percentage of the total history. Divides the total history under/out of stock by the total demand in the History. |
| % of Periods | Calculates the percentage of periods that were either under/out of stock. Takes the total history periods that were under/out of stocks and divides it by the total demand periods in the History. |
| Number of simulation | Determines the number of simulations performed when generating the Event Index values. |
| Fixed | Indicates that a specific number of simulations are performed. |
| % of thresd | Sets a threshold for the variance that indicates the simulation should end. When the variance percentage between the current number generated and the previous number does not exceed the threshold, the simulation process is stopped. |
| Event Replaceable | Specifies whether the same period’s value can be used more than once when evaluating the data for a Seasonality index. |
| Base Forecast Method | Determines the forecasting technique used to calculate the Forecast values. |
| Same | Identifies that the same forecasting technique (Mean or Croston) used to calculate the Historical baseline is also used to calculate the base forecast. |
| Safety Stock | Defines the parameters used to calculate the Safety Stock values. |
| Lead Time | Number of periods of future demand that is to be kept in reserve. |
| Lead - 50 | Percentage of periods of future demand that is to be kept in reserve. |